By: Allvue Team
December 2, 2021
What does PME stand for?
PME stands for public market equivalent. It’s a benchmarking methodology often used to evaluate private asset performance. PME benchmarking allows private equity assets to be compared with public markets, taking into account the restrictions associated with private assets (for example, liquidity) and factoring in the expectation of a higher return.
What is PME and how is it used to benchmark private asset performance?
Investors in the private market know all too well the challenge of trying to evaluate the performance of their investments. While public assets can be measured second-to-second against a litany of indices, benchmarking private equity, private debt, and other alternative investments is more difficult. The longer investment timelines, lock-up periods, and illiquidity of private market alternative investments can make it much more challenging to analyze and benchmark their performance.
The range of potential benchmarks and methods levied by investors is expansive – from internal rate of return (IRR), to modified IRR (MIRR), to cash multiples (which compare fund value to capital that has already been called). PME, or public market equivalent, benchmarking is another of these methods, one often favored for assessing private market assets.
Why would an LP use PME for private equity assets?
PME can be a valuable benchmark for a number of reasons. First, PME in private equity can be used as a way to compare the performance of private and public markets by comparing the two against the same data set. Second, funds that are being allocated to private assets might often have been reallocated from public markets. That makes it all the more important to understand the extent of any performance premium offered by private assets.
How do you calculate public market equivalent ?
Ordinarily, to build a PME benchmark, the public market index most appropriate to the investor or group of investments is chosen, often based on industry and geography. As an example, a global private equity portfolio might be compared to the MSCI World index. Or, as another example, a venture capital fund might be benchmarked against a tech index.
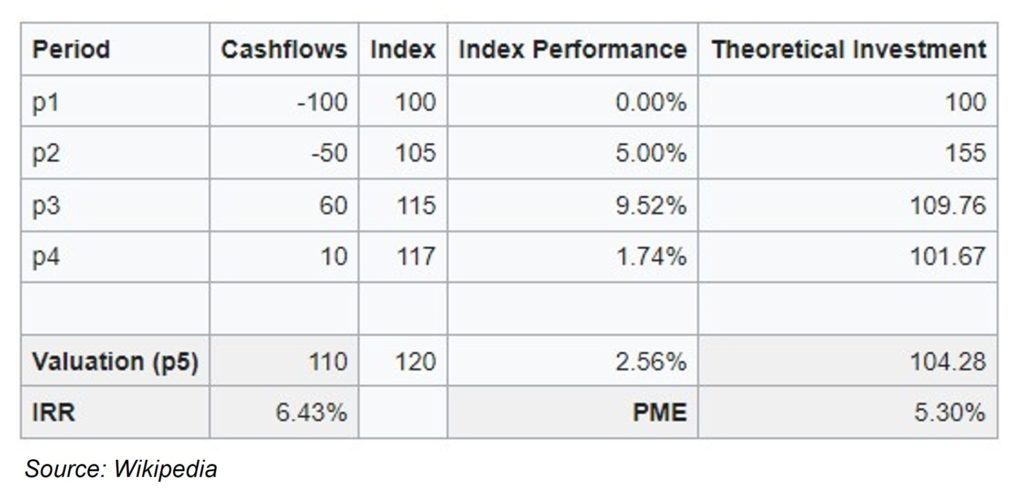
Crucially, the calculation of PME for private equity takes into account the timing and flow of funds, rather than simply comparing private and public market performance. This is part of what makes PME both so powerful as a benchmark and so challenging to calculate. PME benchmarking involves complex calculations based on the assumption that money invested in a particular fund (including both at inception and as a result of subsequent capital calls) is instead invested in the chosen index on the same date (based on end of day pricing). Distributions are also then similarly assumed to match sales from the same index on a specific day. The IRR of the fund over a certain period is compared to the IRR of the public market equivalent over that same period, taking into account the inflows and outflows for each, in order to calculate the IRR spread between the two.
Calculating a PME benchmark

PME+, Long-Nickels PME, and Kaplan Schoar PME
There are a variety of approaches to calculating PME for private equity assets outside of the standard approach we’ve been discussing, also traditionally known as the Long Nickels PME (LN PME) measure, after Austin Long and Craig Nickels, who proposed the first PME measure back in 1996. A handful of the more common variations are listed below:
PME+
PME+, as one would assume, is similar to the standard Long Nickels PME method but involves further complex calculations in an attempt to avoid some of the anomalies that arise from Long Nickels PME – specifically, the issue in Long Nickels PME that an investment outperforming the index will create a negative value in the index theoretical investment. To resolve this, PME+ adjusts the cash flow to avoid big discrepancies – solving the issue but also creating a mismatch between the cash flows of the PME vehicle and the PE fund.
Both PME and PME+ add a premium to public market performance that reflects compensation for the additional risk (including illiquidity) of the private asset class. There is no standardized premium for alternative assets: typically, each investor sets their own level.
Kaplan Schoar PME
KS PME, or Kaplan Schoar PME, differs from both Long Nickels PME and PME+ in that, rather than returning an IRR as those calculations do, it returns a market multiple. So rather than needing to compare the benchmark to the fund’s IRR, as with Long Nickels PME and PME+, Kaplan Schoar PME gives a direct indication of whether the fund outperformed the index – with a Kaplan Schoar PME score of above 1 – or underperformed – noted by a score of below 1.
Direct Alpha
Direct alpha is the most recently created method for comparing private capital returns against a public market equivalent. It uses the same methodology as Kaplan Schoar PME but, rather than returning a market multiple, returns an IRR calculation as does Long Nickels PME and PME+, but with greater consideration for inflows and outflows of the fund. It is the only method to calculate the exact rate of outperformance or underperformance for a fund, rather than an approximation.
The challenges of private equity PME
The value of private equity PME benchmarking – and benchmarking in general – is indisputable. It is the foundational method for how investors evaluate their investments and gauge future commitments. The issue, though, is with how that benchmarking is performed.
For many investors, benchmarking is a manual process, usually tracked through Excel spreadsheets of similar templates. As alternative assets have taken up a larger and larger portion of investors’ portfolios, this exercise has become significantly more difficult as the amount of data that has to be manually handled has grown exponentially.
PME benchmarking, and its variations, only compounds this problem. Investors must first source index information before then calculating the public market equivalent and comparing it to fund performance. While some providers can calculate public market equivalents, they require investors to upload their data every quarter for this purpose: there is still considerable manual effort required to amalgamate investors’ data with the public market equivalent.
This creates not just resourcing issues but real operational challenges and blind spots that open investors up to greater levels of risk. The added time and lack of timely insight into performance that manual benchmarking creates can make it harder for investors to ask salient questions of their GPs at the best time because they simply may not have the right information.
Simplifying private equity PME
No matter which public market equivalent philosophy investors choose to follow, it’s important they have the resources to evaluate performance on a continuous basis without having to manually load in data from . Investors should find the right partners and technology to help them easily pull public market data feeds in order to automatically calculate PME and PME+ using the appropriate index and a predefined risk premium.
By simplifying risk comparison and performance to public markets or private peers, benchmarking capabilities makes it possible to more quickly and accurately determine whether to participate in upcoming fundraising rounds or make additional investments in new asset classes.


